The main reason for pushing for 51 separate websites in the first place was mainly just an attempt to win over a few conservative "states rights" votes in Congress from Republicans and some conservative Democrats. There were some practical advantages to doing it this way as well (potential innovations from trying things different ways, plus a few states like Vermont and Massachusetts wanted to offer additional financial assistance beyond the normal tax credits/cost sharing provisions, and Hawaii already has an existing state law which is actually better than some of the provisions included via the federal exchange)...but on the whole, the sheer economy of scale advantages of one federal site make the downsides seem pretty small in comparison for most states.
Earlier this week the New Jersey Dept. of Banking & Insurance put out a press release with the final 2026 ACA Open Enrollment Period data for the state:
Enrollment Expected to Decline As Federal Changes Continue to Impact Affordability
TRENTON —More than 509,000 New Jersey residents enrolled in health insurance coverage for 2026 through Get Covered New Jersey, the state’s Official Health Insurance Marketplace, during the Open Enrollment Period. However, the state is cautioning that the full effect of the loss of federal subsidies has not impacted the marketplace yet and is predicting a material drop off in enrollment this Spring.
Today at the White House, Vice President J.D. Vance, Secretary of Health and Human Services (HHS) Robert F. Kennedy, Jr., and Administrator of the Centers for Medicare & Medicaid Services (CMS) Dr. Mehmet Oz announced new steps to crack down on fraud in Medicare and Medicaid to protect patients and taxpayers and improve affordability. The actions include deferring $259.5 million of quarterly federal Medicaid funding in Minnesota to prevent payment of questionable claims while further investigation is completed; a nationwide moratorium on Medicare enrollment for certain Durable Medical Equipment, Prosthetics, Orthotics, and Supplies (DMEPOS) suppliers; and a nationwide call to action for Americans to support fraud prevention, including stakeholder input on how CMS can continue to expand and strengthen its efforts.
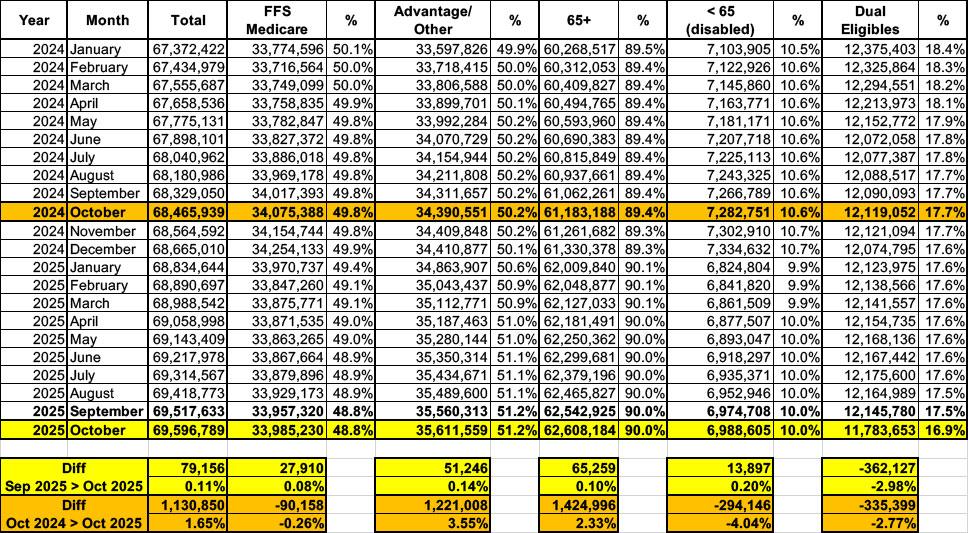
Whether the data posted since January 20, 2025 is accurate or not, I can't say for certain, but at least they're updating it...and so far, at least, I don't see anything in their monthly reports which is setting off any obvious red flags.
In any event, according to the latest report, as of November 2025:
Expanded outreach and new financial assistance helped keep residents covered
HARTFORD, Conn. (Feb. 19, 2026) — Access Health CT (AHCT), Connecticut’s official health insurance marketplace, today announced a record number of Connecticut residents enrolled in health and dental insurance during the 2026 Open Enrollment Period, which began Nov. 1, 2025 and ended Jan. 31, 2026. This is the third year in a row AHCT has seen record-breaking enrollment.
A total of 157,246 people enrolled in a Qualified Health Plan (QHP) during the 2026 Open Enrollment Period, compared to 151,151 at the end of the Open Enrollment Period in 2025. This year’s enrollment broke last year’s record by 4%.
Included in that number are 51,629 residents enrolled in the Covered CT Program, compared to 41,165 during the Open Enrollment Period last year. Covered CT provides no-cost coverage for eligible residents. The State of Connecticut pays the consumer portion of premiums and cost-sharing.
It may not make any difference but believe it or not sometimes it does, even under the Trump regime...and in fact in some cases they're actively stating that they're seeking comment as opposed to just ramming the proposed changes through.
The Patient Protection & Affordable Care Act includes a long list of codified instructions about what's required under the law. However, like any major piece of legislation, many of the specific details are left up to the agency responsible for implementing the law.
UPDATE: Someone correctly pointed out that it’s a bit unfair to tell people to “be afraid” without giving them any action items to try and stave off the uglier changes being proposed. You have until March 13th to submit a comment to CMS. It may not make any difference but believe it or not sometimes it does, even under the Trump regime.
The Patient Protection & Affordable Care Act includes a long list of codified instructions about what's required under the law. However, like any major piece of legislation, many of the specific details are left up to the agency responsible for implementing the law.
WASHINGTON — The U.S. Department of Health and Human Services (HHS) announced today it is implementing important measures to expand access to more affordable catastrophic health coverage through HHS’ new hardship exemption guidance. This guidance streamlines access to more affordable catastrophic coverage for consumers who are ineligible for advance payments of the premium tax credit (APTC) or cost-sharing reductions (CSRs).
Through these efforts, more Americans will be able to qualify for catastrophic health coverage based on need, beginning November 1st with the start of open enrollment.
Let's stop a moment and look at what Catastrophic Plans actually are.


