Medicare Advantage (technically "Medicare Part C" & originally called "Medicare+Choice") is a type of health plan in the United States offered by private companies as part of the original Social Security Act of 1965 that created Medicare. It permits a private insurance option that wraps around traditional Medicare. Medicare Advantage plans attempt to fill some coverage gaps and offer alternative coverage options.
Under Part C, Medicare pays a plan operator a fixed payment for each enrollee. The operator then pays for their medical expenses. Traditional Medicare directly compensates providers on a fee-for-service basis. Plans are offered by integrated health delivery systems, labor unions, non profit charities, and health insurance companies, which may limit enrollment to specific groups of people (such as union members).
Whether the data posted since January 20, 2025 is accurate or not, I can't say for certain, but at least they're updating it...and so far, at least, I don't see anything in their monthly reports which is setting off any obvious red flags.
In any event, according to the latest report, as of November 2025:
Whether the data posted since January 20, 2025 is accurate or not, I can't say for certain, but at least they're updating it...and so far, at least, I don't see anything in their monthly reports which is setting off any obvious red flags.
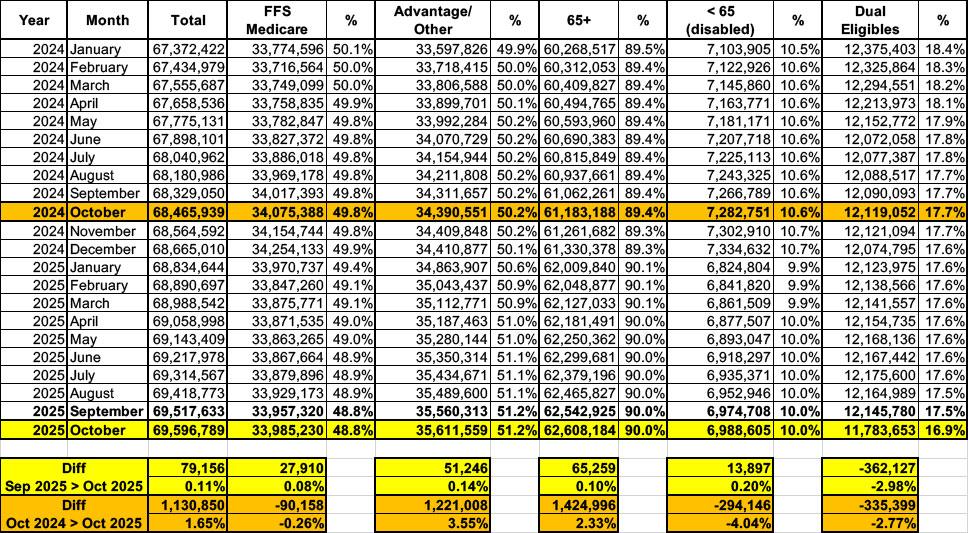
In any event, according to the latest report, as of October 2025:
Whether the data posted since January 20, 2025 is accurate or not, I can't say for certain, but at least they're updating it...and so far, at least, I don't see anything in their monthly reports which is setting off any obvious red flags.
In any event, according to the latest report, as of September 2025:
Total Medicare beneficiaries are up to 69.36 million (up ~77K month over month)
Traditional/FFM Medicare beneficiaries are at 33.79 million (flat m/m)
Medicare Advantage beneficiaries reached 35.57 million (up ~77K m/m)
12.12 million Medicare enrollees (around 17.5% of the total) were "Dual Eligibles"...that is, enrolled in both Medicare and Medicaid.
The only number which seems odd is the 384K increase in Dual Eligibles...I'm not sure what to make of that.
Whether the data posted since January 20, 2025 is accurate or not, I can't say for certain, but at least they're updating it...and so far, at least, I don't see anything in their monthly reports which is setting off any obvious red flags.
In any event, according to the latest report, as of August 2025:
Total Medicare beneficiaries are up to 69.3 million (up ~86K month over month)
Traditional/FFM Medicare beneficiaries are at 33.79 million (down ~31K m/m)
Medicare Advantage beneficiaries reached 35.49 million (up ~55K m/m)
11.73 million Medicare enrollees (around 16.9% of the total) were "Dual Eligibles"...that is, enrolled in both Medicare and Medicaid.
The only number which seems odd is the 375K drop in Dual Eligibles...I'm not sure what to make of that.
Whether the data posted since January 20, 2025 is accurate or not, I can't say for certain, but at least they're updating it...and so far, at least, I don't see anything in their monthly reports which is setting off any obvious red flags.
In any event, according to the latest report, as of June 2025:
Whether the data posted since January 20, 2025 is accurate or not, I can't say for certain, but at least they're updating it...and so far, at least, I don't see anything in their monthly reports which is setting off any obvious red flags.
In any event, according to the latest report, as of May 2025:
Whether the data posted since January 20, 2025 is accurate or not, I can't say for certain, but at least they're updating it...and so far, at least, I don't see anything in their monthly reports which is setting off any obvious red flags.
In any event, according to the latest report, as of April 2025:
With the pending dire threat to several of these programs (primarily Medicaid & the ACA) from the House Republican Budget Proposal which recently passed, I'm going a step further and am generating pie charts which visualize just how much of every Congressional District's total population is at risk of losing healthcare coverage.
USE THE DROP-DOWN MENU ABOVE TO FIND YOUR STATE & DISTRICT.


